Thermal behavior of a TOB rod prototype
Where to find the files:
Hostname: pcepcmt17.cern.ch
Username: control
(To have the password, ask me or Laurent)
Directory: ~/slow
TOB rod setup:
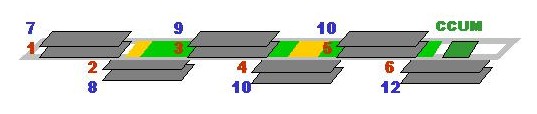
Have a look here.
Induction of noise from the temperature probes:
The external probes attached to the system can induce additional noise.
To study the noise, launch ~/anal/job/test1_rob.job and then analyze the ntuples with the macro ~/anal/anal/showpfast.kumac (which shows several noise estimators for every APV; a nicer display, joining APVs in modules, is obtained by ~/anal/anal/showp3.kumac).
Reference runs: 20690 (before installation of the probes) 20694 (after installation of the probes). A worsening of the noise profile is apparent (it's particularly clear from a comparison of page 4 of these files).
To do: check it for run 20702 (see later) both in the transient and in the plateau.
Pedestal vs time:
A pedestal run (number 20702) was taken on 15/5/2003 from 11:42:33 to 12:01:30. The aim is to correlate the rise of the noise during this run with the thermal evolution of the system (our guess is that the variation in the pedestals is due to a variation in the gain of the optohybrids).
To analyze it, run ~/anal/job/test1_andrea.job as explained here, having care that the flag ROB has the value FALSE (i.e.: noise analysis; with TRUE the program executes the physics analysis described in tob.html).
The ntuples can be read by ~/slow/ped.f, which writes an only row-wise ntuple with the correct module numbering.
This new ntuple can be read by the PAW macro ~/slow/ped.kumac, showing the evolution of the average ADC counts per APV as a function of the event number.
Warning: only the first 600 seconds are plotted, due to memory problems:
***** ERROR in HRZOUT : An error has occured whilst writing data : ID= 1
RZOUT . Request exceeds quota
To do:
- Understand the anomalous time evolution for some APVs in the cases module=4 and module=7. Why don't they increase as the others?
Temperature vs time:
In the slow control database you can find all the data from DCU, embedded and external probes.
In the "command" field, the instruction
select * from slowcontrol where name='dcu'
will give only the records relative to the DCU readings, name='emb probe' and name='ext probe' will give the embedded and external probes readings. Save the output pages as output_dcu.html, output_probes_emb.html and output_probes_ext.html.
Program ~/slow/readdb.f (to be compiled with gmake -f readdb.mk) reads data from these html files, recognizes the type (this is not trivial for DCUs, for which the routine ~/slow/idconvert.f has been designed) and writes them in text files to be analyzed in PAW with ~/slow/plot.kumac. It also converts, calling ~/slow/timeconversion.f, the timestamp (written as milliseconds from 1/1/1970) in hh:mm:ss (warning: in solar time!).
Thermal measurements performed:
- 15/5/2003: temperatures measured with external+embedded probes; T of the coolant: 19.1oC. No DCU measurement. Pedestal run 20702 was taken in the meantime.
- External + embedded probes; the probes with the insulating tape give higher curves (as expected); note: the TSi embedded probes oscillate too much; to do: for understandability, label every single curve with the corresponding probe number.
- With exe plot fit=1 the macro performs an exponential fit in the raising and descending parts of the curve for the probe number 2 (see the list), obtaining a time constant of 292.3 seconds for the rising and 300.4 seconds for the descent (~5 minutes).
- 16/5/2003: temperatures measured with external+embedded probes and from the DCU; T of the coolant: 18.9oC.
- 21/5/2003: T of the coolant: 14oC, then raised to 16.5oC.
- 22/5/2003: air conditioning had been switched off the evening before; T of the coolant: 23oC, but the air outside the cage had T~28oC (too hot to thermalize). Then, air conditioning was switched on again and the box left open on purpose, until the ambient was stable around 23oC.
Calibration curves obtained with macro ~/slow/calib2.kumac, using only the first measurement of every data set.
With this calibration, the temperature readings from the DCU, for 16/5/2003 data, are these (also shown are the 2.5 and 1.25 volts tensions and the leakage current). How do we justify these spreadings in temperature?
To do: perform the calibration using all the points from all the data sets, and make a comparison with the calibration from the only first points.
The calibration with only the first points, while having much less statistics, is also much less affected by systematics arising from dissipation (we believe that dissipation also explains the deviations from linearity in the calibration curves shown in the list above). The comparison should help to estimate this effect.
Open issues:
- The TSi embedded probe behavior.
- The anomalous time evolution of the pedestals for some APVs.
- The spread in temperature between the different DCUs.
Position of the temperature probes:
External probes (with normal duct tape when not otherwise specified):
- 1: support of the hybrid in module 7, near to the cooling pipe.
- 2: optohybrid connected to module 11; special insulating tape used.
- 3: optohybrid connected to module 7.
- 4: not used.
- 5: air outside the cage.
- 6: optohybrid connected to module 1.
- 7: support of the hybrid in module 7, in the middle (far from the cooling pipe).
- 8: cooling pipe.
- 9: support of the hybrid in module 9, near to the cooling pipe.
- 10: air inside the cage.
- 11: support of the hybrid in module 9, in the middle (far from the cooling pipe); special insulating tape used.
- 12: optohybrid connected to module 5; special insulating tape used.
- 13: carbon fiber.
- 14: air (plexiglass) over the DCU of module 9.
- 15: support of the hybrid in module 11, in the middle (far from the cooling pipe); special insulating tape used.
- 16: top cover of the rod.
Embedded probes:
- Tliq: temperature of the coolant.
- Tair: temperature of the air.
- TSi1,TSi2: temperature of the silicon. Warning: both are taken as the parallel of two resistors. Function TNEW in file ~/slow/readdb.f converts this false temperature in the average temperature of the two resistors (assuming they are equal, as they should be).
DCU channels:
- 0: T (not connected)
- 1: V2.5
- 2: V1.25
- 3: leakage current
- 4: T of the hybrid
- 5: unknown
- 6: unknown
- 7: T internal of the DCU
Contact me (andrea.giammanco@pi.infn.it) for any question about the files.